Archive: This content is maintained for historical reference. Please note that the specific versions and commands may no longer be compatible with modern systems.
I am adding some logstash-forwarder examples here as a reminder, and maybe in the hope that they might help someone else.
You can test your Grok patterns at this website: https://grokdebugger.com/. This tool is incredibly useful for verifying that your Grok patterns work correctly.
Below, I will provide a full example for an Nginx access.log, followed by configurations for other programs I find interesting.
Example: Nginx access.log
Step 1: Create the patterns directory
$ sudo mkdir -p /opt/logstash/patternsStep 2: Set the correct user and group for the patterns directory
$ sudo chown logstash:logstash /opt/logstash/patternsStep 3: Create a log_format for Nginx
$ sudo vi /etc/nginx/nginx.confAdd the following piece of code inside the http block. This is the default Nginx code and may already be present:
log_format main '$remote_addr - $remote_user [$time_local] "$request" '
                '$status $body_bytes_sent "$http_referer" '
                '"$http_user_agent" "$http_x_forwarded_for"';
Step 4: Add a filter to your Logstash config
$ sudo vi /etc/logstash/logstash.confAdd the following filter:
filter {
  if [type] == "nginx-access" {
    grok {
      match => { "message" => "%{NGINXACCESS}" }
    }
  }
}
Step 5: Add the log file and field to the logstash-forwarder config
$ sudo vi /opt/logstash-forwarder/conf/logstash-forwarder.confInside your files bracket, add the following:
{
  "paths": [
    "/var/log/nginx/kibana/access.log"
  ],
  "fields": { "type": "nginx-access" }
}
Step 6: Create the Nginx pattern for Logstash
$ sudo vi /opt/logstash/patterns/nginxAdd the following pattern:
NGINXACCESS %{IPORHOST:remote_addr} - %{USERNAME:remote_user} \[%{HTTPDATE:time_local}\] "%{WORD:method} %{URIPATHPARAM:request} HTTP/%{NUMBER:httpversion}" %{INT:status} %{INT:body_bytes_sent} %{QS:http_referer} %{QS:http_user_agent}Save the file and set the correct permissions:
$ sudo chown logstash:logstash /opt/logstash/patterns/nginxIf configured correctly, it should look like this:
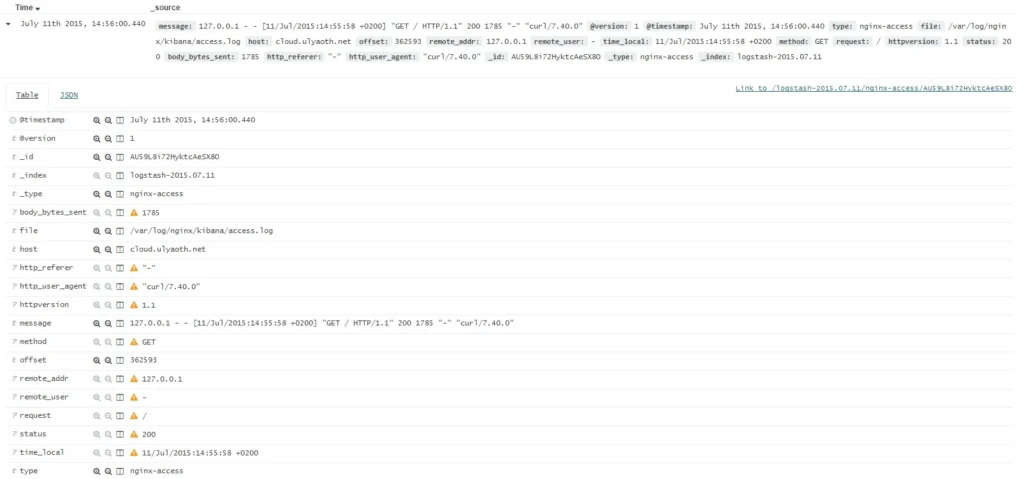
As you can see, the log file is now fully parsed into individual fields, allowing for much better graphing and data visualization.