Archive: This content is maintained for historical reference. Please note that the specific versions and commands may no longer be compatible with modern systems.
This guide provides a comprehensive example of how to install the Elastic Stack on a Windows environment for anyone who is not interested in using Linux.
This guide was created by hosting all applications on the same server. If you use different servers, you must account for firewalls and alter the guide accordingly to fit your situation.
This guide was tested on: Windows Server 2019
So, let’s start!
Download all requirements
Elasticsearch:
https://artifacts.elastic.co/downloads/elasticsearch/elasticsearch-6.6.0.msi
Kibana:
https://artifacts.elastic.co/downloads/kibana/kibana-6.6.0-windows-x86_64.zip
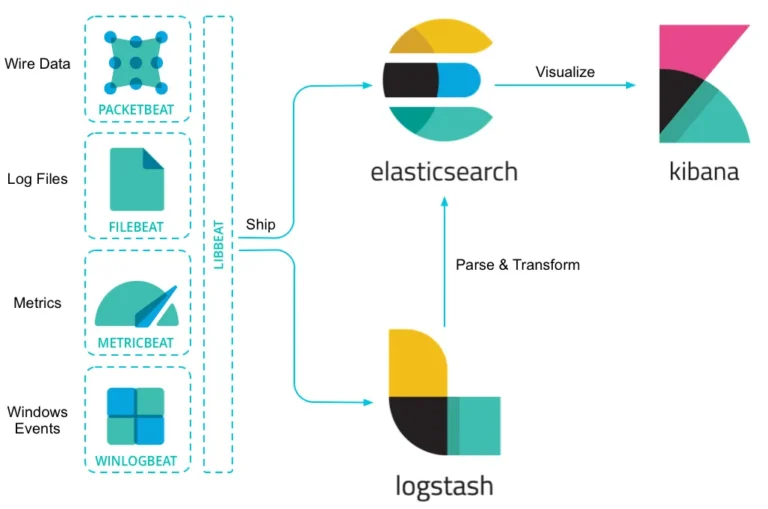
Shippers (Beats):
- Packetbeat: https://artifacts.elastic.co/downloads/beats/packetbeat/packetbeat-6.6.0-windows-x86_64.zip
- Winlogbeat: https://artifacts.elastic.co/downloads/beats/winlogbeat/winlogbeat-6.6.0-windows-x86_64.zip
- Metricbeat: https://artifacts.elastic.co/downloads/beats/metricbeat/metricbeat-6.6.0-windows-x86_64.zip
- Heartbeat: https://artifacts.elastic.co/downloads/beats/heartbeat/heartbeat-6.6.0-windows-x86_64.zip
Brief Explanation:
- Packetbeat is for analyzing your network data.
- Winlogbeat is for shipping Windows event logs.
- Metricbeat is for shipping and analyzing metrics.
- Heartbeat is for uptime monitoring.
Service Manager:
DaemonMaster: https://github.com/TWC-Software/DaemonMaster/releases
WinPcap (Required for Packetbeat): https://www.winpcap.org/install/bin/WinPcap_4_1_3.exe
DaemonMaster is required to run Kibana as a Windows service.
Now, simply extract all the ZIP files to a folder. I created a folder called “ulyaoth” in C:\ulyaoth\ to make things easier.
For me, the structure looks like this:
C:\ulyaoth\kibana-6.6.0C:\ulyaoth\heartbeat-6.6.0C:\ulyaoth\metricbeat-6.6.0C:\ulyaoth\packetbeat-6.6.0C:\ulyaoth\winlogbeat-6.6.0
Please be aware that if you change the naming of the directories or files, you must update the paths in this guide to fit your situation.
To continue, we first need to install a Java JDK version on the server, as this is required by the Elastic Stack packages.
Installing Java JDK
Download the JDK version of Java and install it. Go to the Java website: https://www.oracle.com/technetwork/java/javase/downloads/jdk11-downloads-5066655.html
(Note: Since Oracle updates Java frequently, please download the latest version and ignore if my version is slightly older in the following images.)
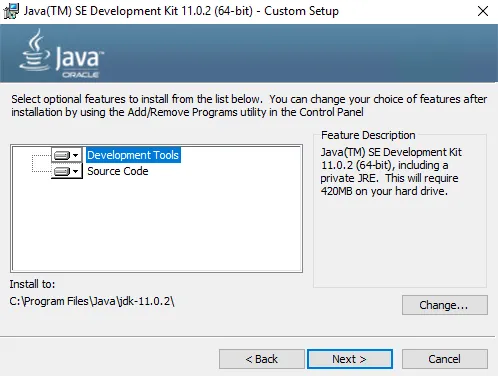
Accept the license and download the “Windows x64 (jdk-11.0.2_windows-x64_bin.exe)” package. Now, install it by double-clicking the file.
You should now see:
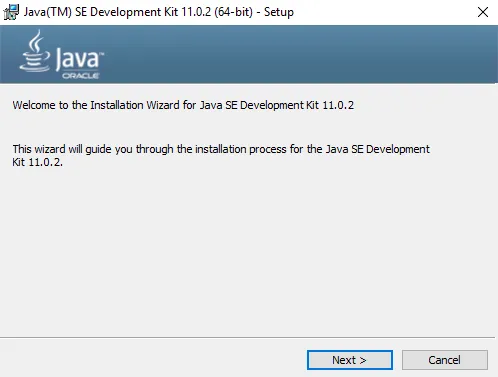
In this window, press “Next” to see the next screen.
On this window, press the “Next” button again.
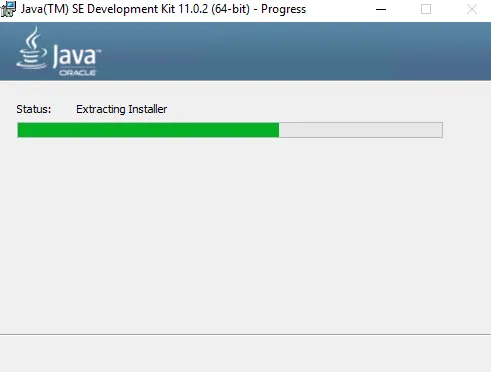
This window indicates that Java is installing. Wait until it completes to see the next screen.
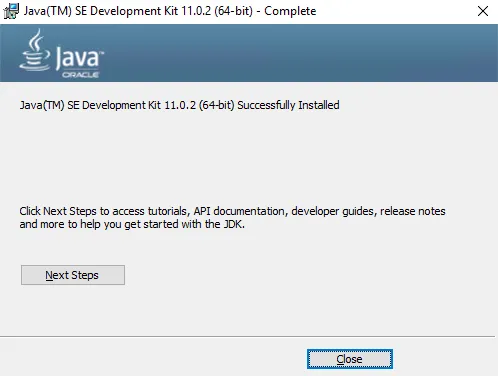
Congratulations, Java is now installed! Press the “Close” button.
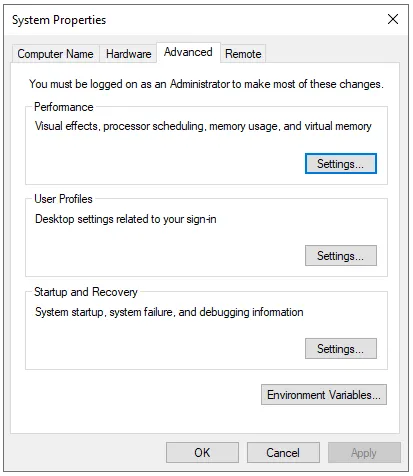
Now, let’s add the JAVA_HOME variable to the server. Right-click on “This PC” and choose “Properties.” You should see the following screen:
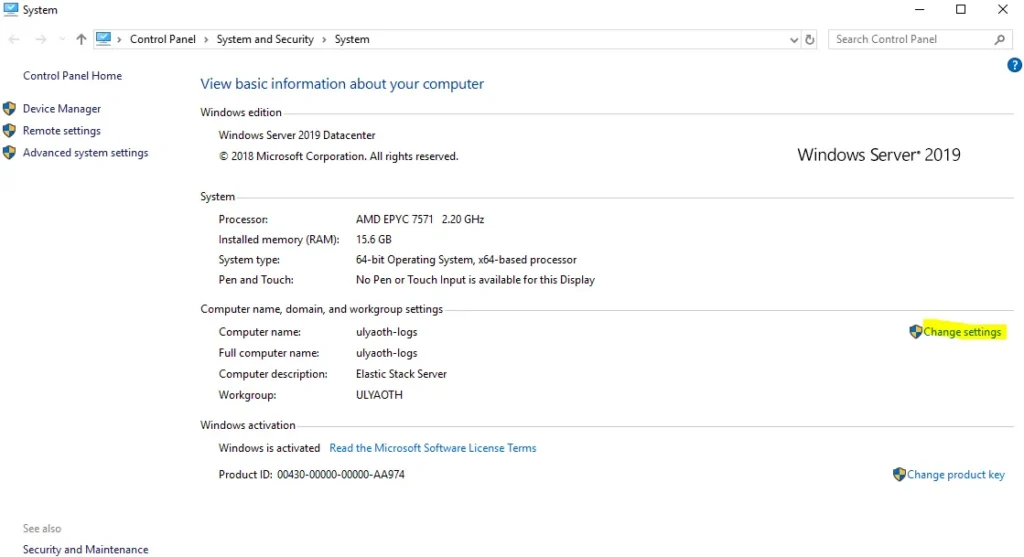
Press “Change settings” (marked in yellow on the screenshot) and go to the Advanced tab:
On this tab, click the “Environment Variables…” button. Under the “System variables” window, click the “New…” button and fill it in as follows:
- Variable Name: JAVA_HOME
- Variable Value: C:\Program Files\Java\jdk-11.0.2
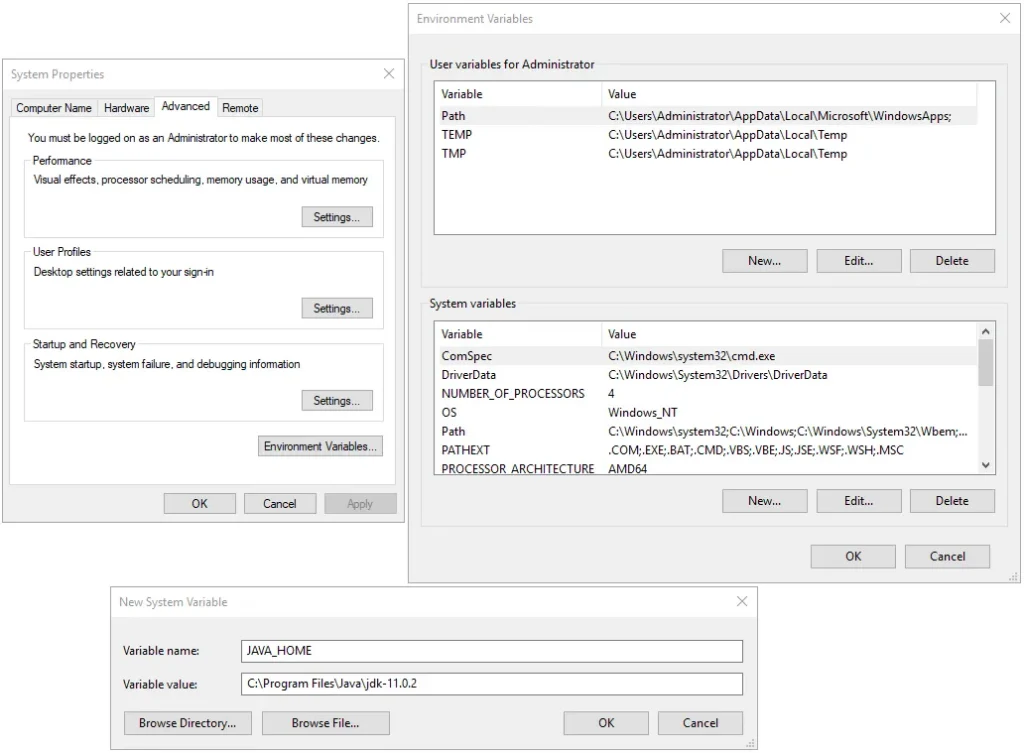
If it looks the same as above, press “OK” three times to close all windows.
Prepare IIS (Reverse Proxy)
It is not advisable to put Kibana directly onto the internet, so we will use IIS as a reverse proxy.
Open Server Manager:
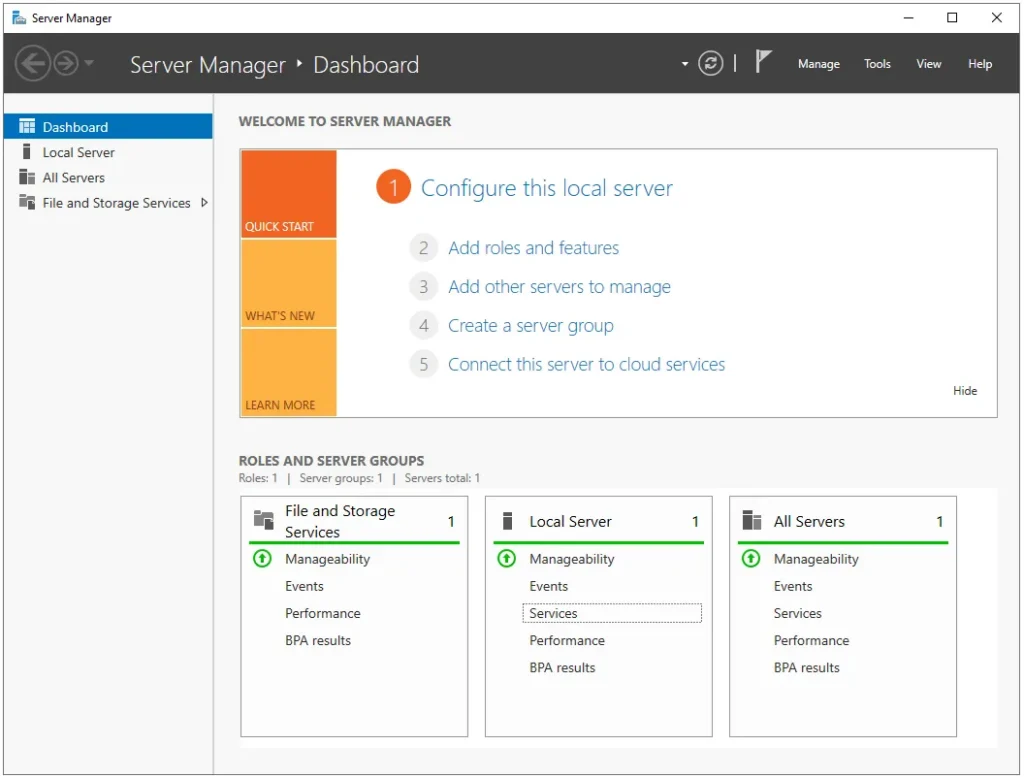
Click on “(2) Add roles and features” and a new window should appear:
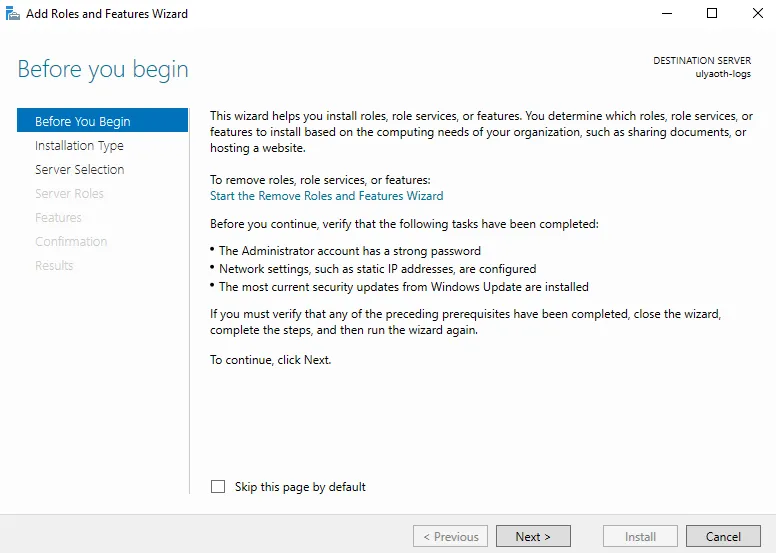
On this page, press “Next.”
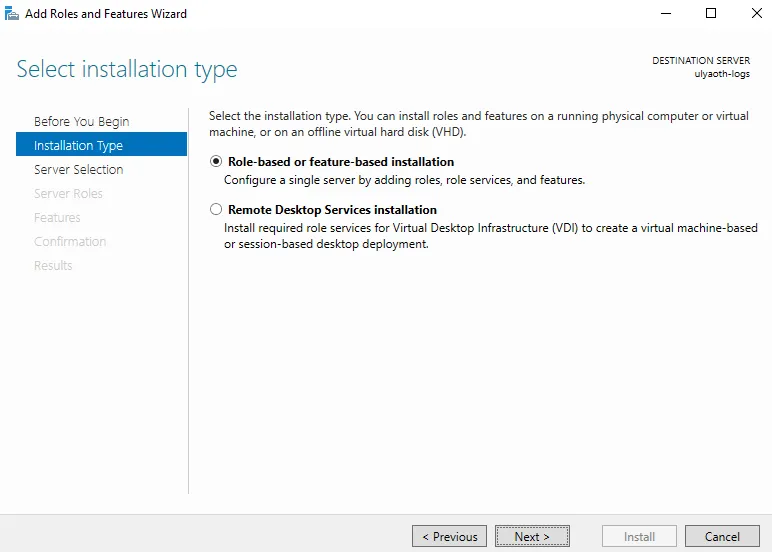
Leave the default selection “Role-based or feature-based installation” and press “Next” again.
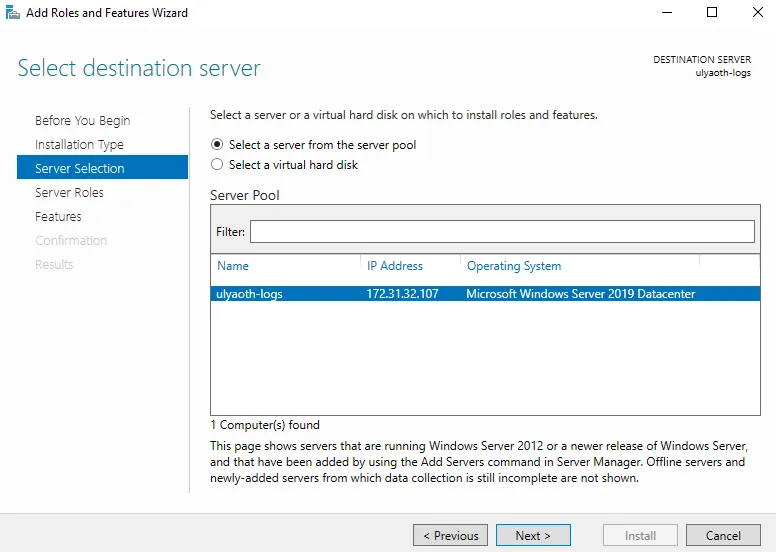
If your settings match mine, press “Next” again.
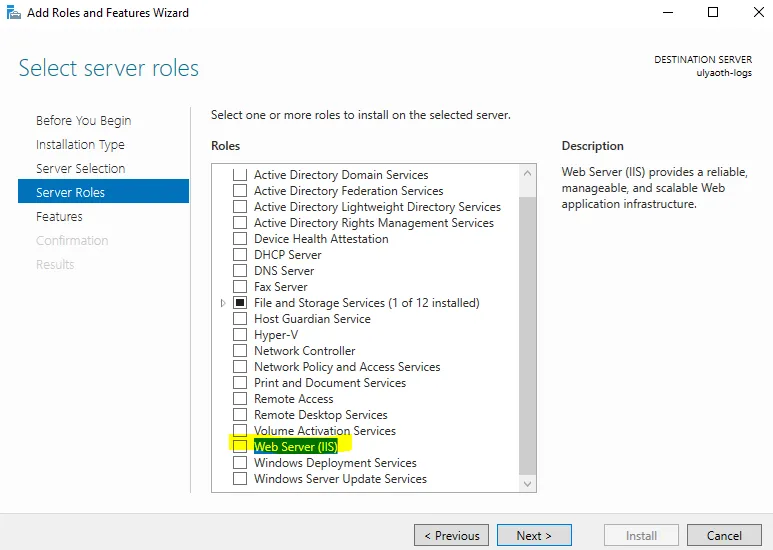
Scroll down until you see “Web Server (IIS)” (marked with a yellow line) and click the checkbox. A new window will open:
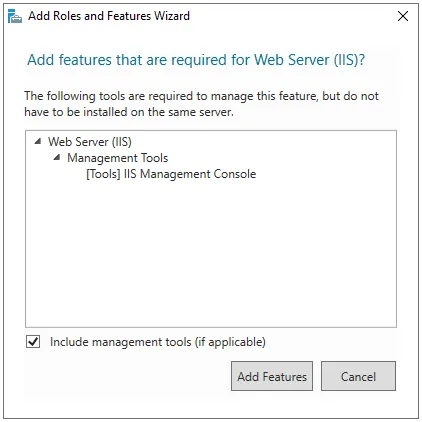
Press the “Add Features” button. You will return to the previous screen where you can now press “Next.”
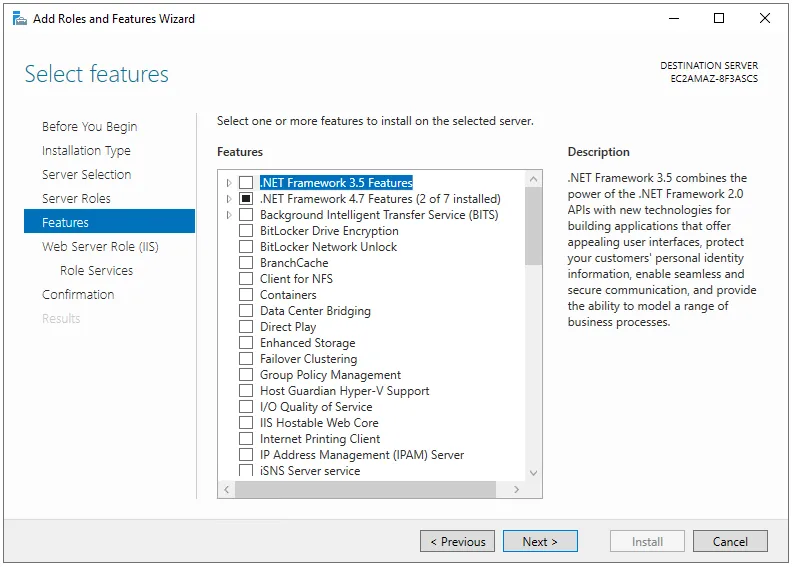
You can choose to install additional features here; however, we do not require them for this guide, so simply press “Next.”
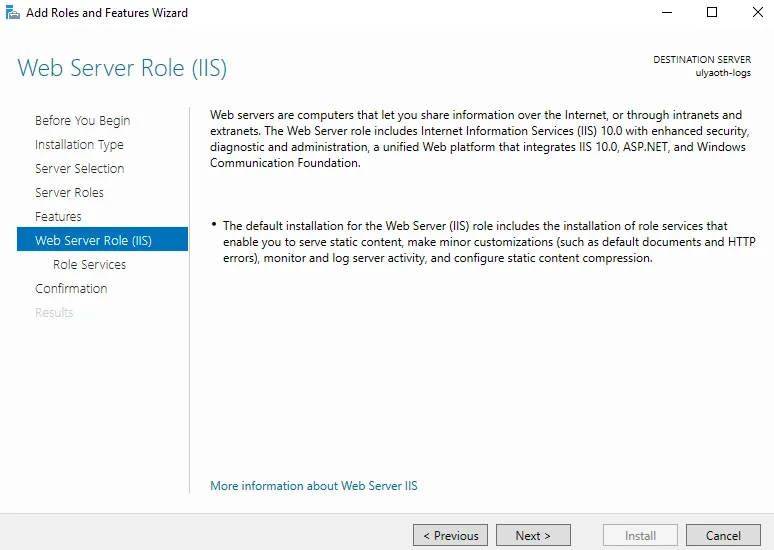
On this informative page, press “Next” again.
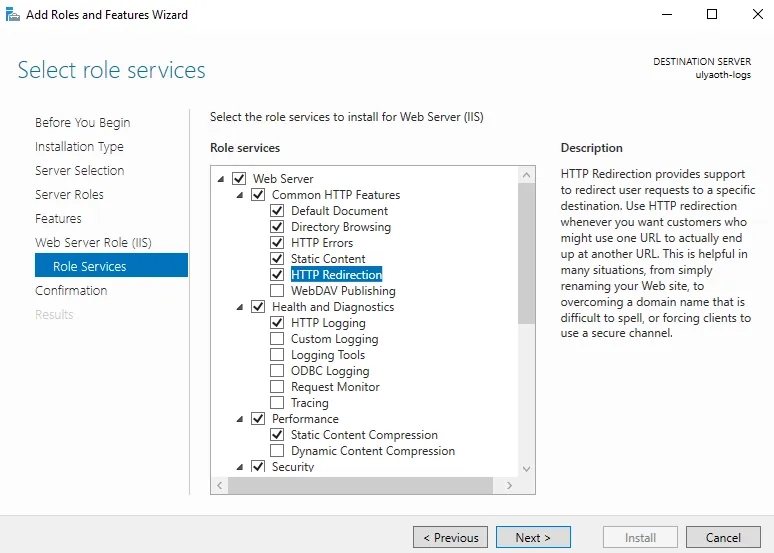
On this page, you can select options for your IIS web server. I usually select “HTTP Redirection” as it is a useful option. If you need nothing else, press “Next” again.
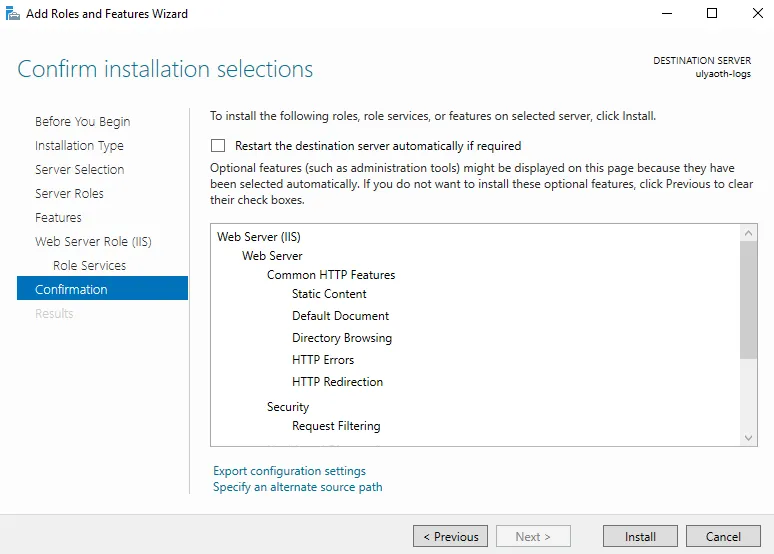
This confirmation window shows everything that will be installed. Double-check the list and press the “Install” button.
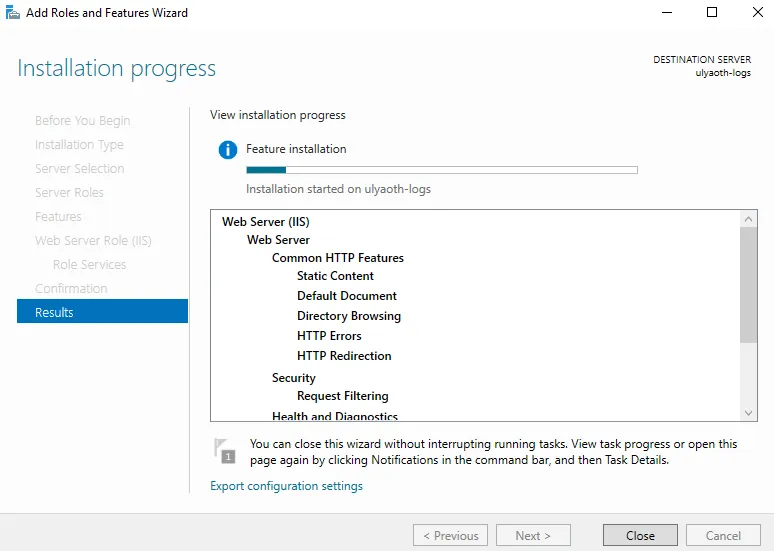
When the bar is fully blue and indicates completion, press the “Close” button. IIS is now installed.
Install Microsoft Web Platform Installer
Go to the following website and download the file “WebPlatformInstaller_amd64_en-US”: https://go.microsoft.com/fwlink/?LinkId=287166
Double-click the file and you will see the following:
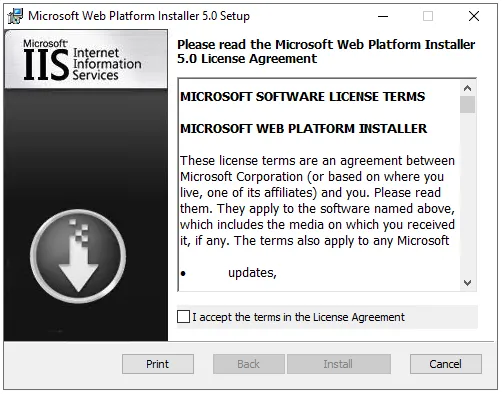
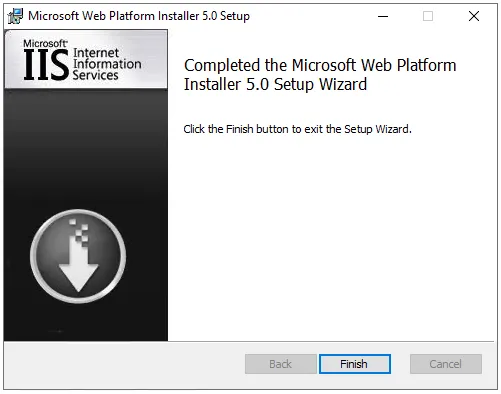
Accept the terms and click “Install.” After a moment, you will see:
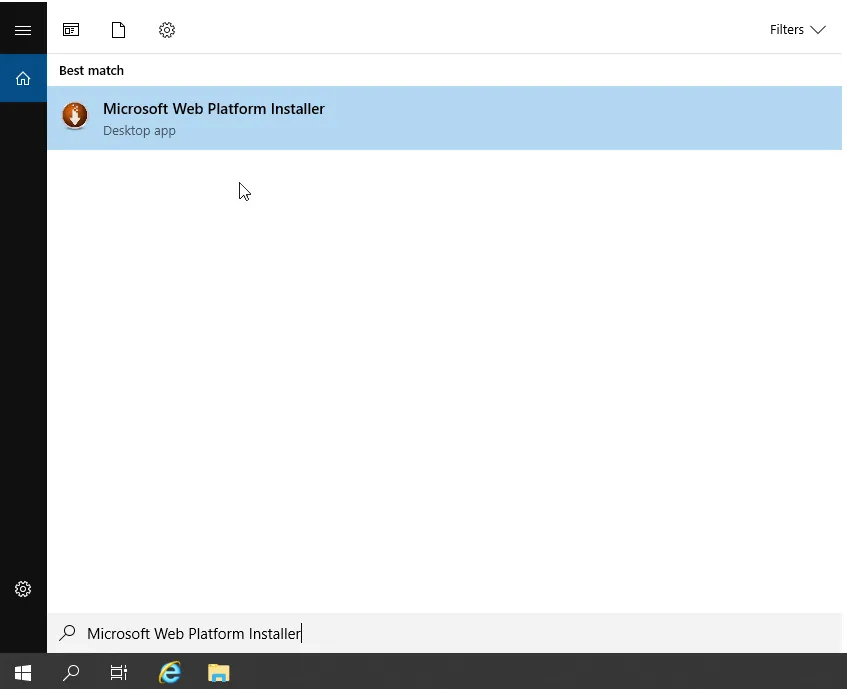
Click “Finish.” Now, click the “Search” button on your taskbar and search for “Microsoft Web Platform Installer”:
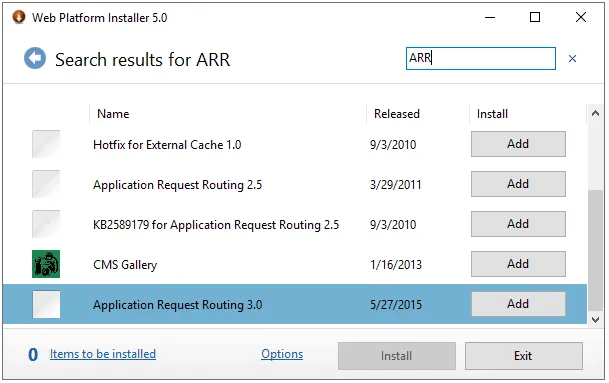
Open the application. In the search box, type ARR and press Enter. Find “Application Request Routing 3.0” and press the “Add” button:
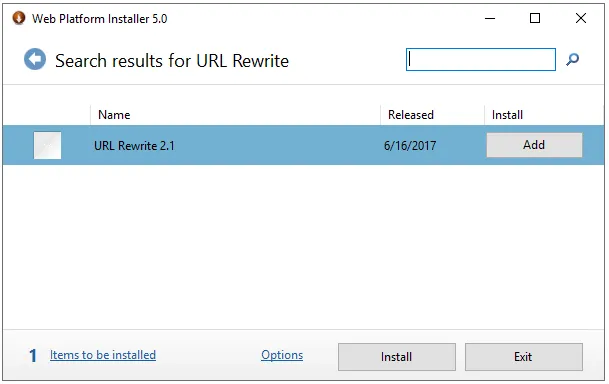
Next, search for “URL Rewrite” and add “URL Rewrite 2.1”:
Press the “Install” button. The following popup will appear:
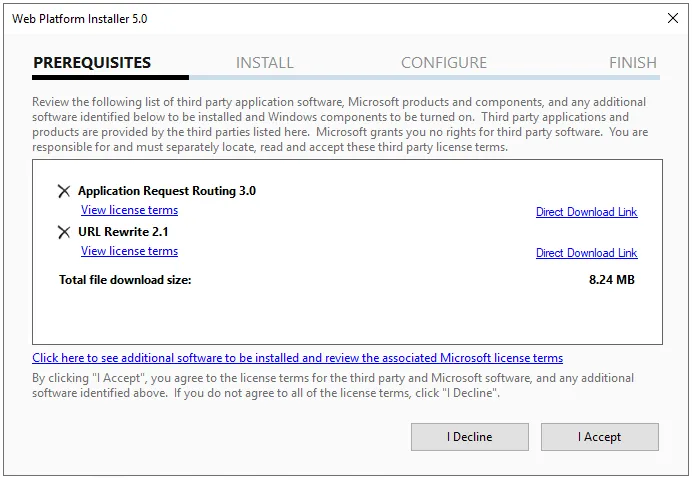
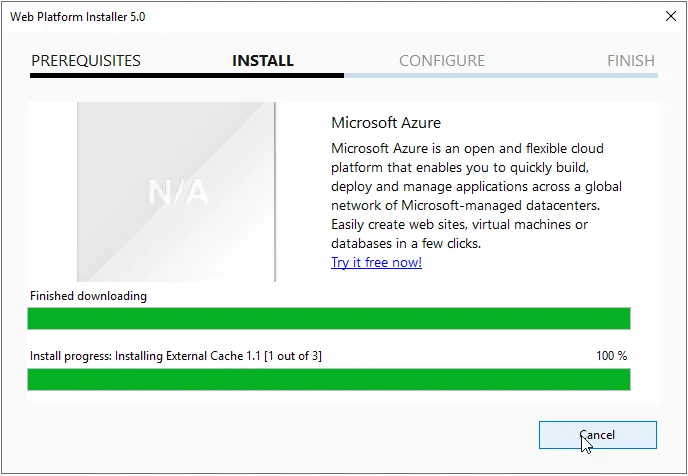
Press “I Accept” to start the installation. It should look like this:
Once finished, a confirmation window will appear:
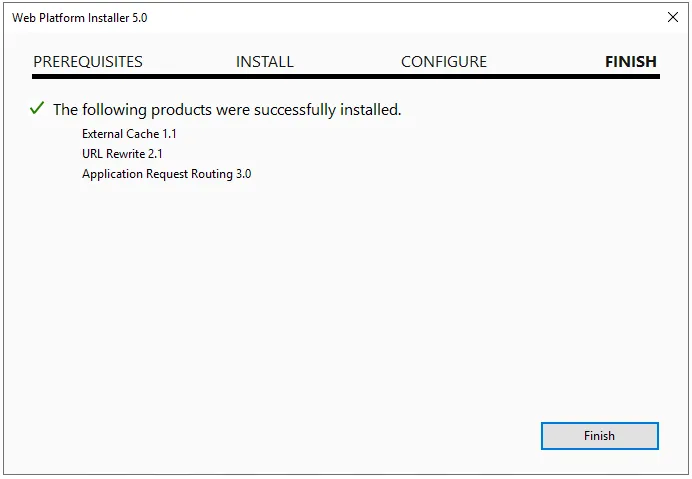
Press “Finish” and then “Exit.”
Configure the Website and Reverse Proxy
Before continuing, create a directory for your website (it can be empty). For this tutorial, I will use the default IIS directory: C:\inetpub\wwwroot. I recommend creating your own directory and including a simple index.html file to show if Kibana is unavailable.
Open IIS Manager:
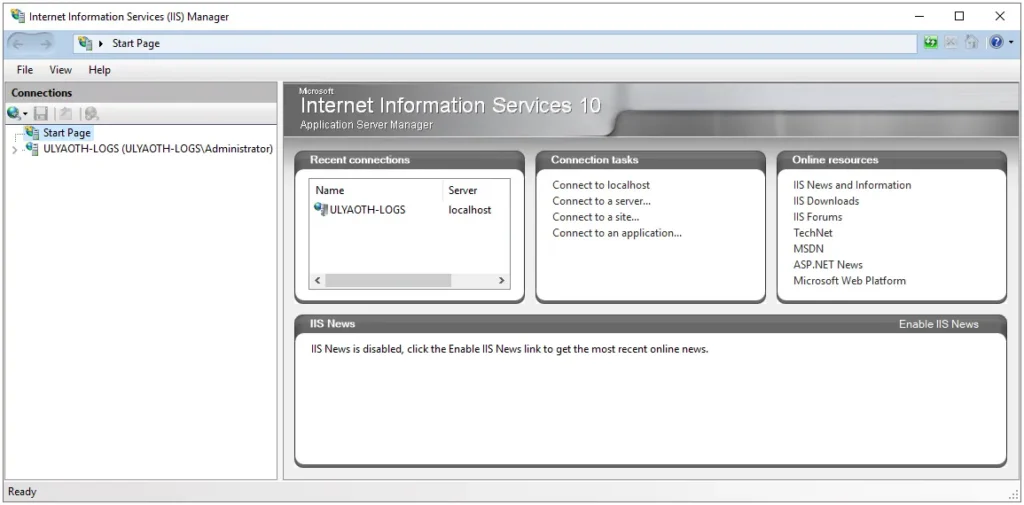
In the left pane, expand your hostname (mine is “ULYAOTH-LOGS”). Right-click on “Sites” and click “Add Website.”
(Note: If you see an enabled “Default Web Site,” you must stop it or this tutorial may not work correctly.)
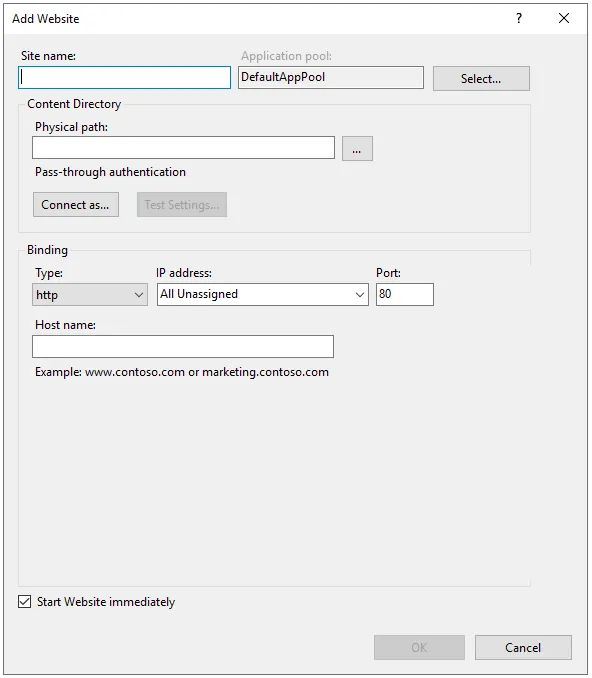
Fill in your information. If you wish to use SSL, change the “Type” field to “https” and select your SSL certificate.
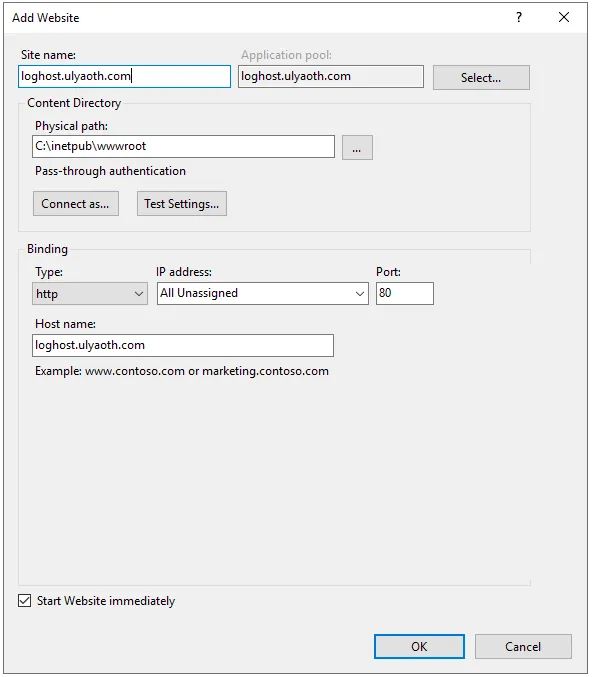
If you want to use my naming convention, you must update your hosts file. Open PowerShell and type:
cd C:\Windows\System32\drivers\etcnotepad hosts
Add this line to the bottom:
127.0.0.1 loghost.ulyaoth.com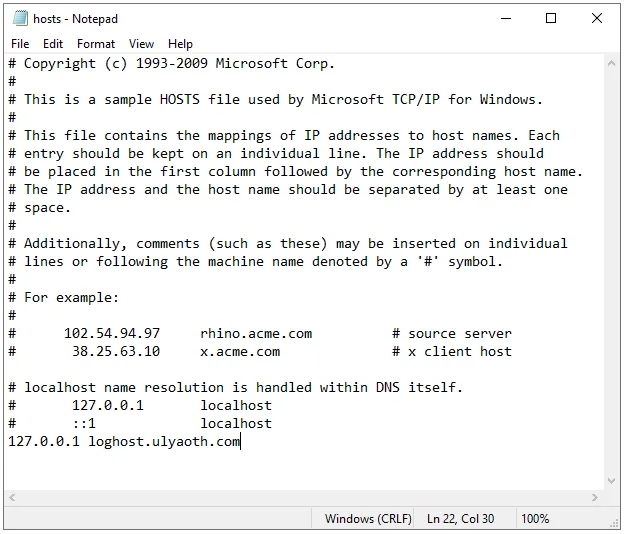
Now, click on your newly created site (e.g., “loghost.ulyaoth.com”). Several icons will appear:
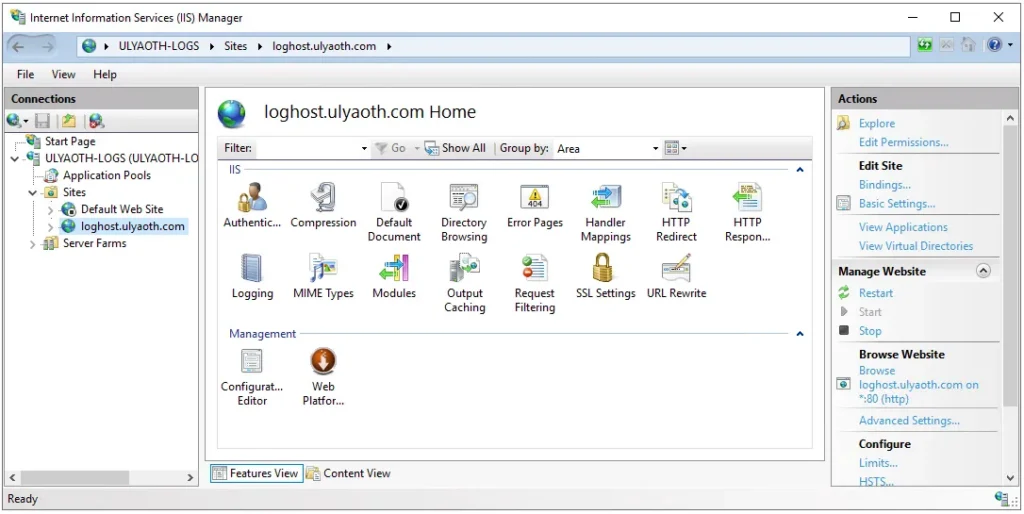
Double-click on “URL Rewrite”:
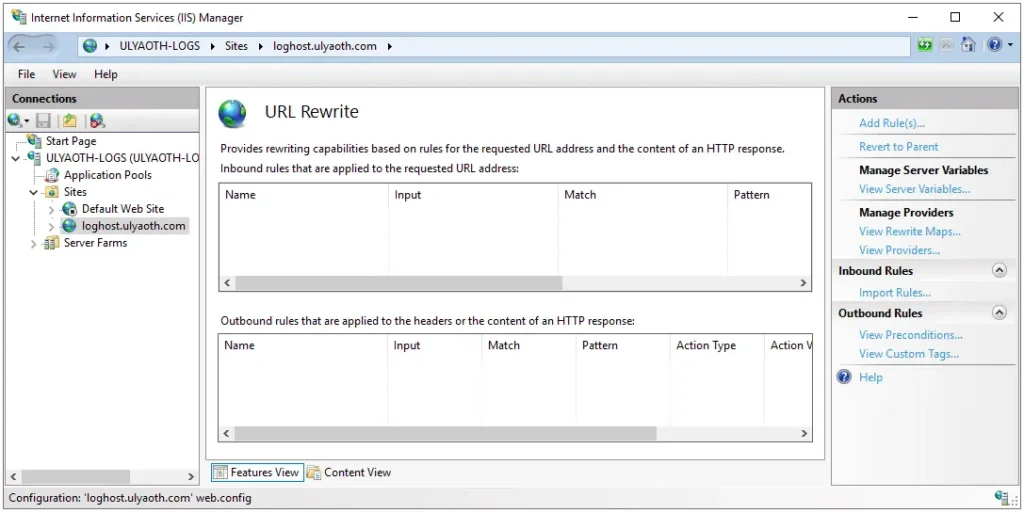
In the right menu, click “Add Rule(s)…”:
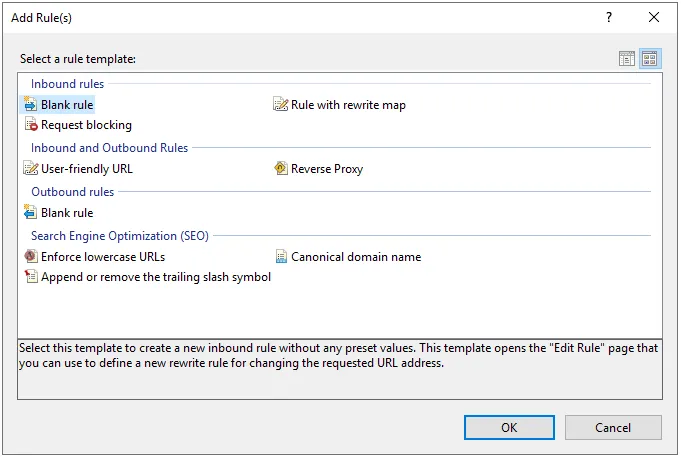
Select “Reverse Proxy” and click “OK.”
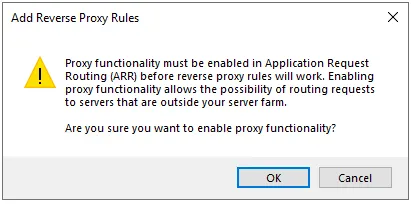
Read the warning and press “OK.” Now, fill in the reverse proxy information:
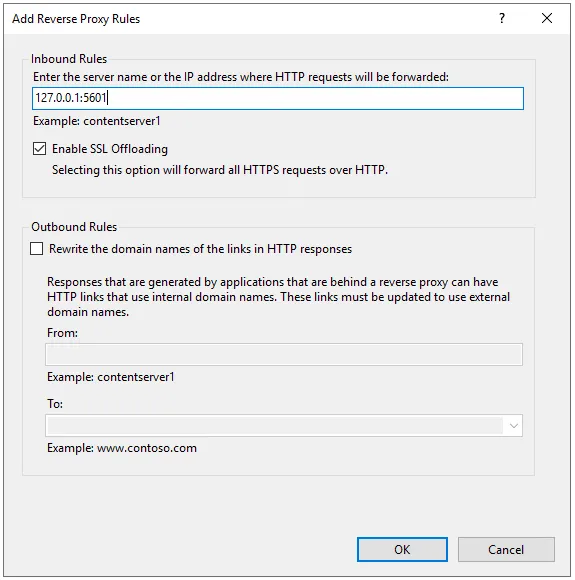
In the Inbound Rules box, enter: 127.0.0.1:5601. Press “OK.”
This directs IIS to Kibana, which runs on port 5601. This setup is more secure than exposing Kibana directly to the internet.
Install Elasticsearch
Double-click the “elasticsearch-6.6.0.msi” file:
Click “Next.”
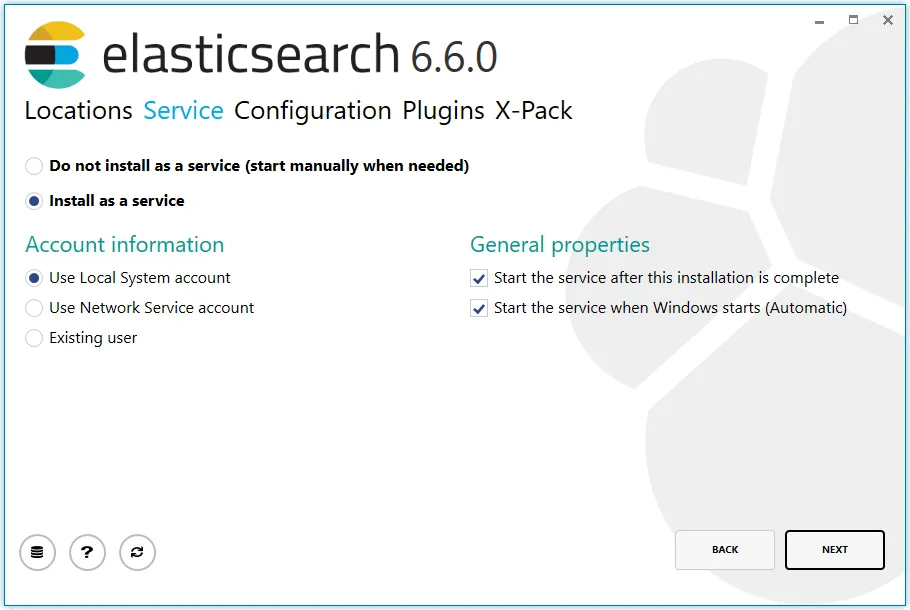
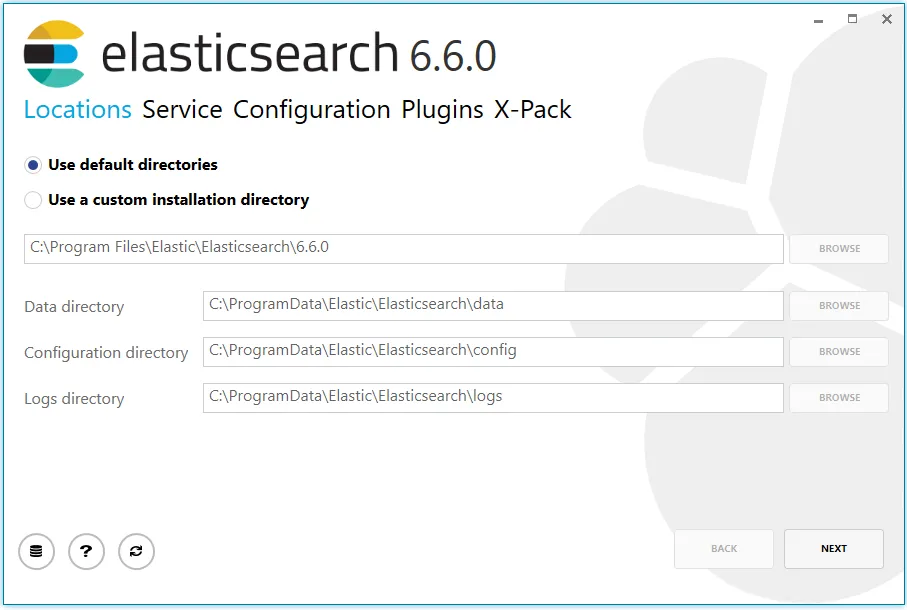
For this tutorial, leave everything as default and click “Next.”
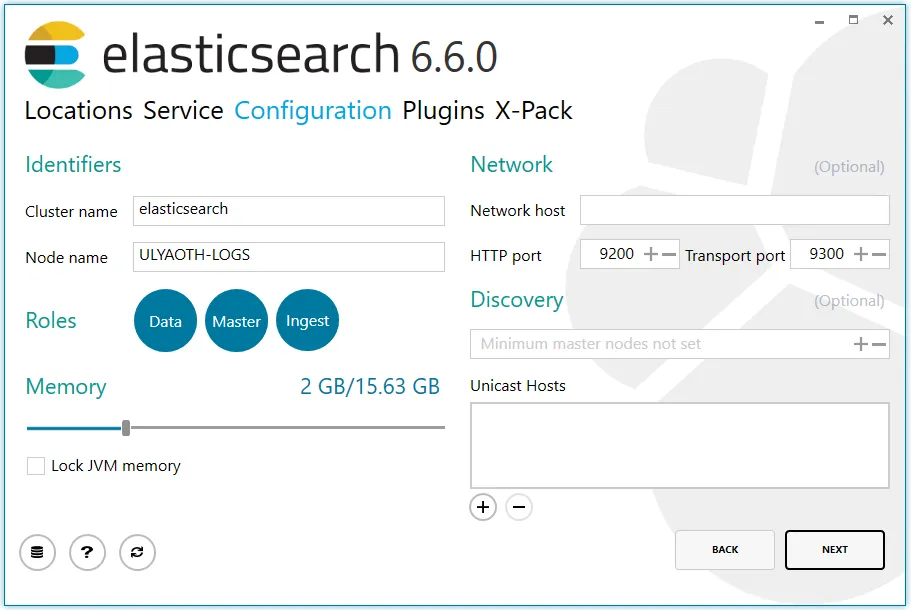
Since we are using only one server, leave this page as is and click “Next.”
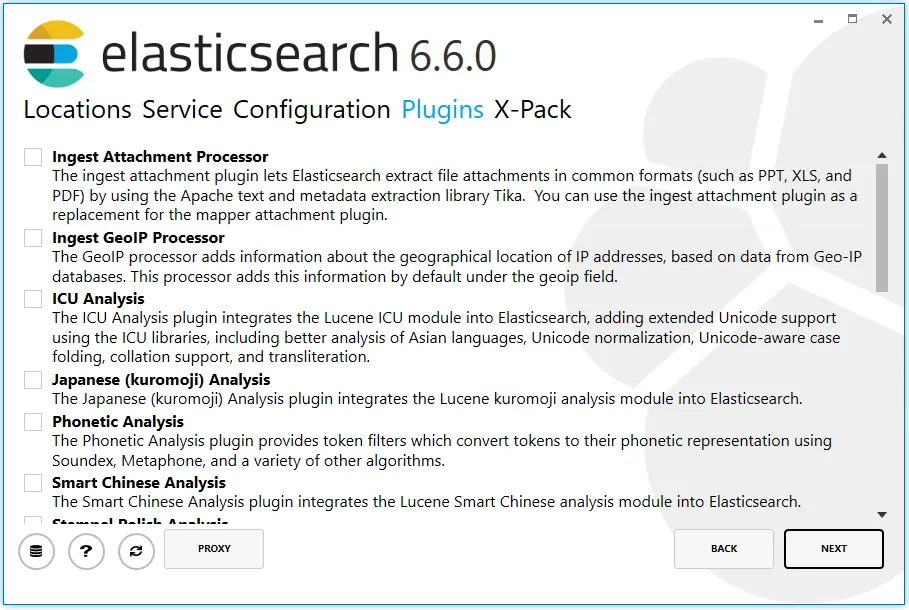
You can add plugins here (like GeoIP), but we will leave this as default. Press “Next.”
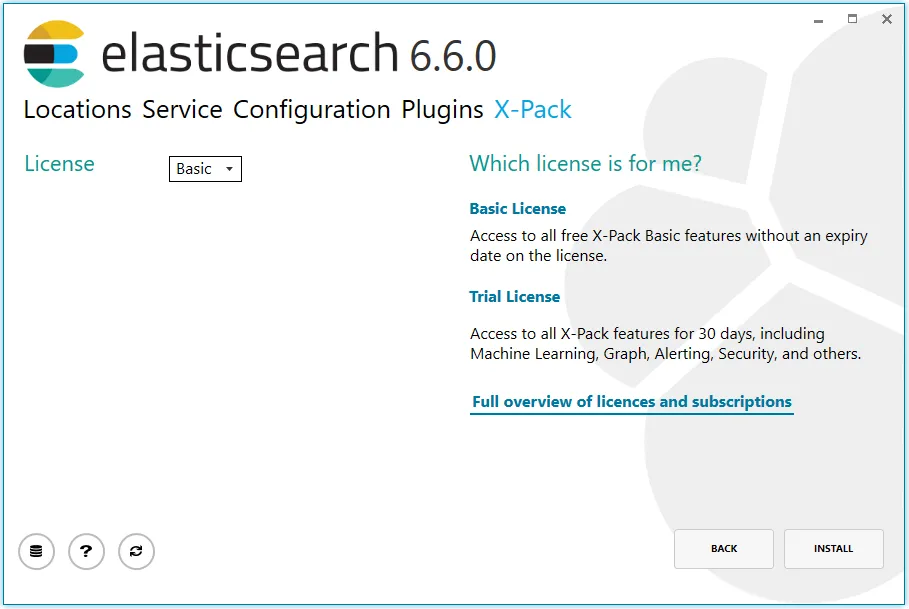
Choose the “Basic” license and click “Install.” Once successful, you will see:
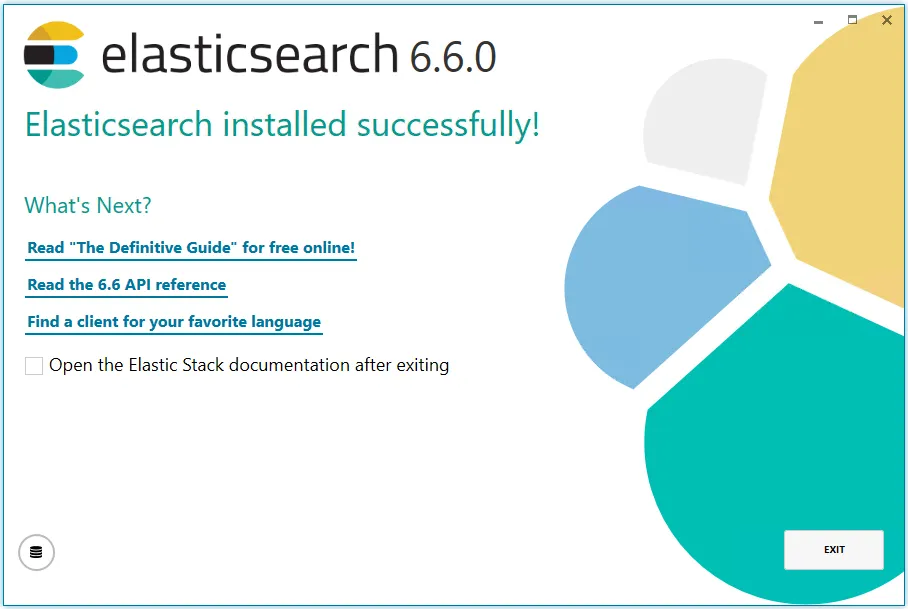
Press “Exit.” (Note: If the service doesn’t start, I found I had to manually create the logs folder in PowerShell: cd "C:\Program Files\Elastic\Elasticsearch\6.6.0", then mkdir logs, then start the service.)
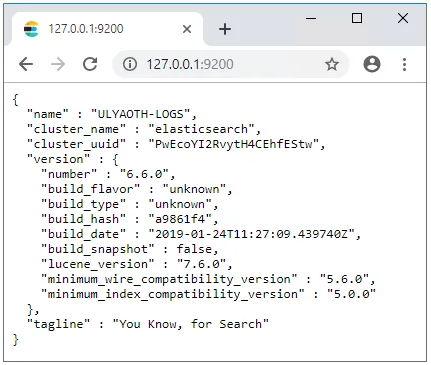
Test Elasticsearch by browsing to 127.0.0.1:9200.
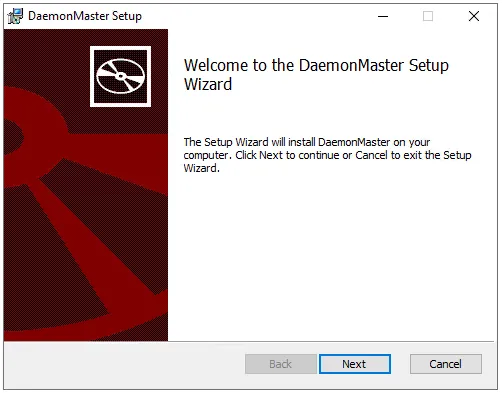
Install DaemonMaster and Kibana Service
We will use DaemonMaster to run Kibana as a Windows service. Double-click the installer:
Click “Next.”
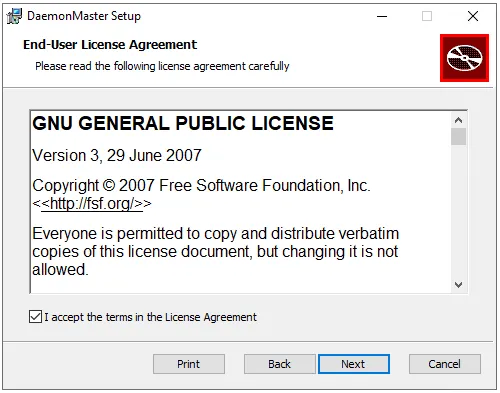
Accept the license and press “Next.”
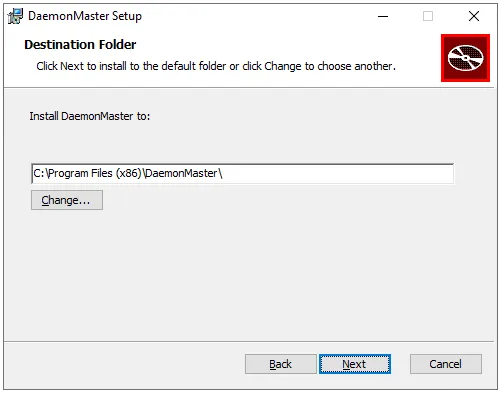
Leave the defaults and press “Next.”
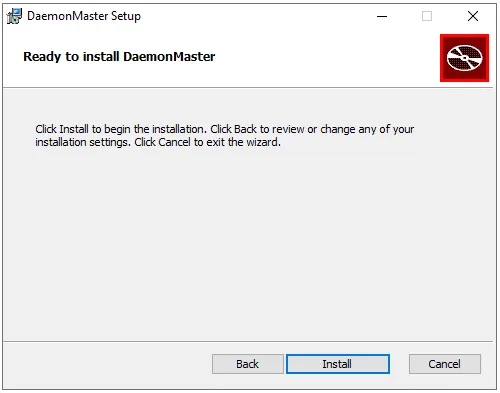
Press “Install.”
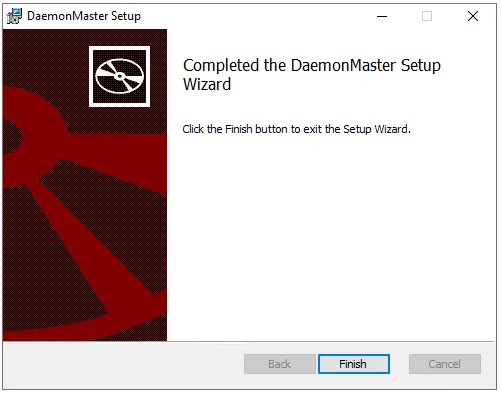
Press “Finish.” Now, open DaemonMaster from your desktop.
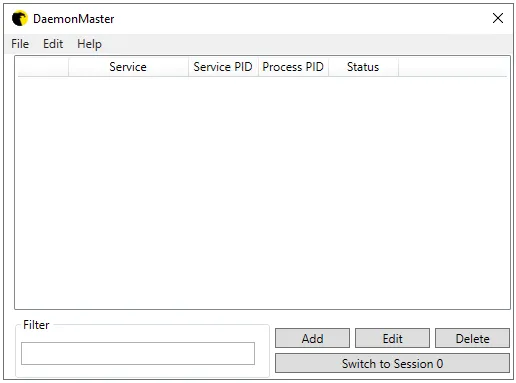
Click “Add” and fill in the service details as shown below:
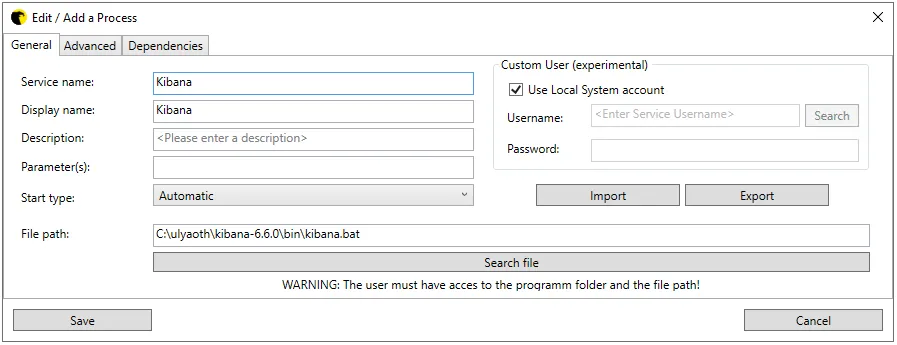
Press “Save.” Right-click the “Kibana” service and choose “Start Service.”
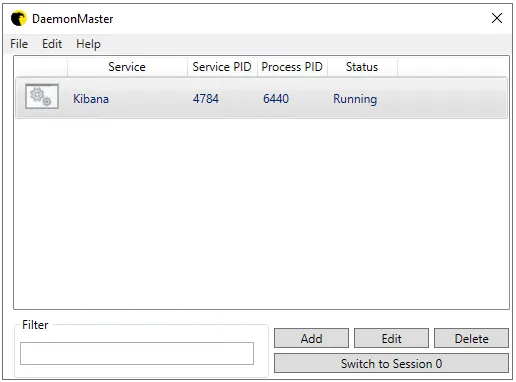
Press “Save” again and close DaemonMaster.
Test Kibana by browsing to your domain (e.g., loghost.ulyaoth.com). You should see:
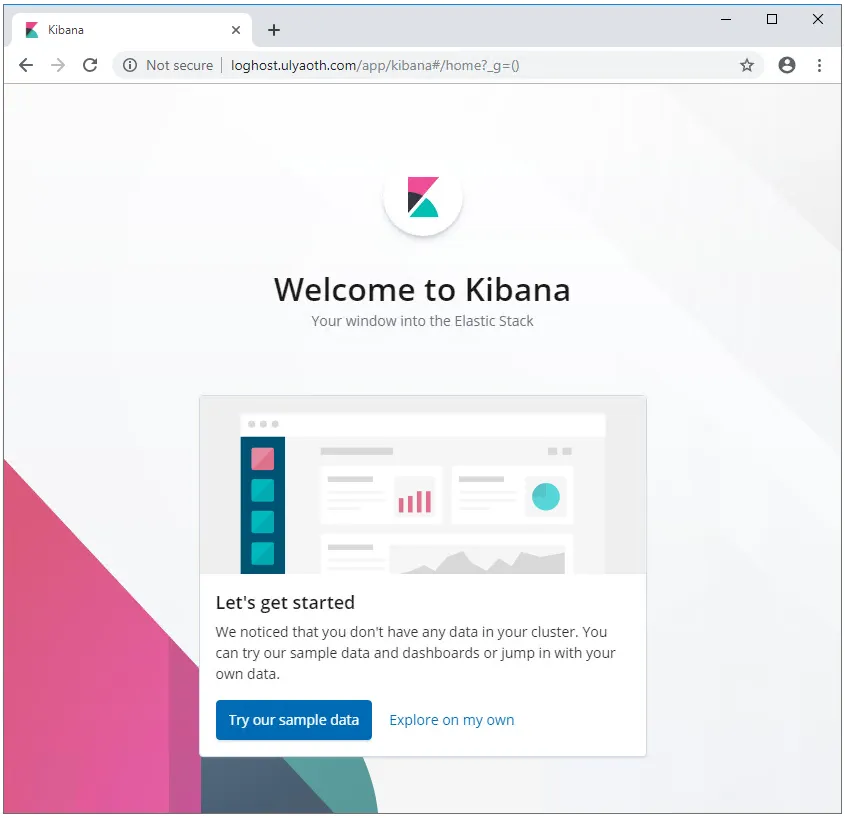
Click “Explore on my own” to enter the interface.
Install Beats
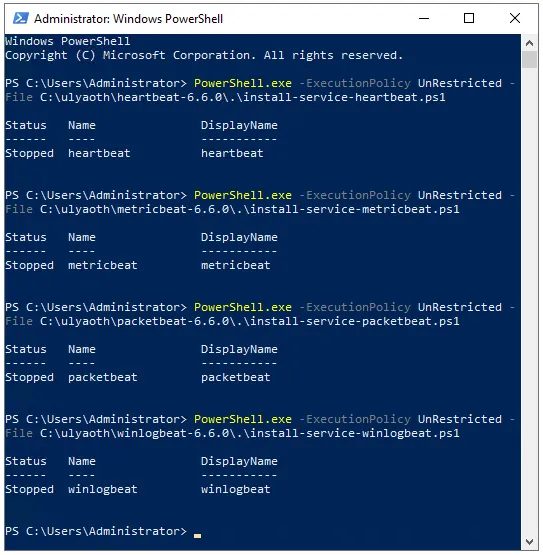
We will now install the Beats to ship data. Open PowerShell and run these commands:
PowerShell.exe -ExecutionPolicy UnRestricted -File C:\ulyaoth\heartbeat-6.6.0\install-service-heartbeat.ps1
PowerShell.exe -ExecutionPolicy UnRestricted -File C:\ulyaoth\metricbeat-6.6.0\install-service-metricbeat.ps1
PowerShell.exe -ExecutionPolicy UnRestricted -File C:\ulyaoth\packetbeat-6.6.0\install-service-packetbeat.ps1
PowerShell.exe -ExecutionPolicy UnRestricted -File C:\ulyaoth\winlogbeat-6.6.0\install-service-winlogbeat.ps1
If you see a security warning, choose “R” for “Run once.” Once finished, you will see:
For Packetbeat, you must install WinPcap. Double-click WinPcap_4_1_3.exe:
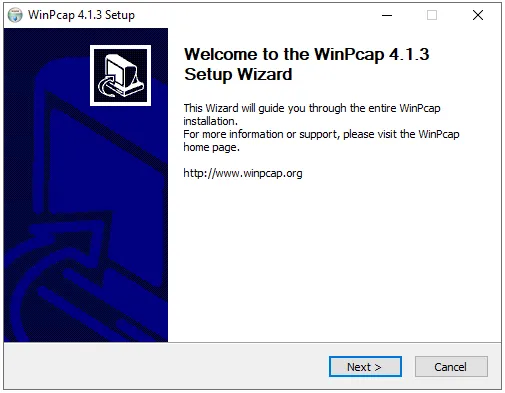
Click “Next.”
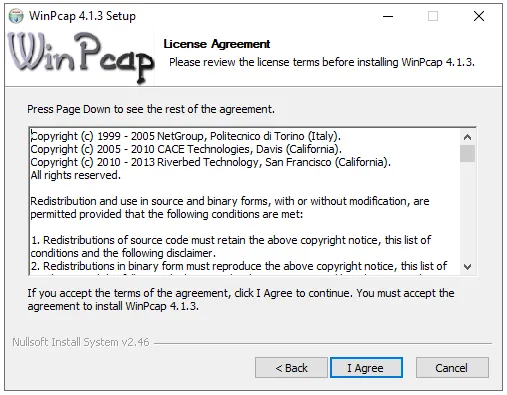
Click “I Agree.”
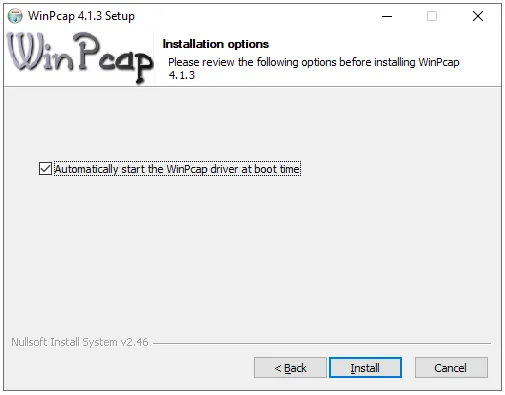
Click “Install.”
Click “Finish.” Now, open Services and start the following: heartbeat, metricbeat, packetbeat, and winlogbeat.
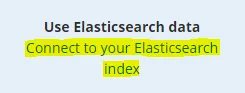
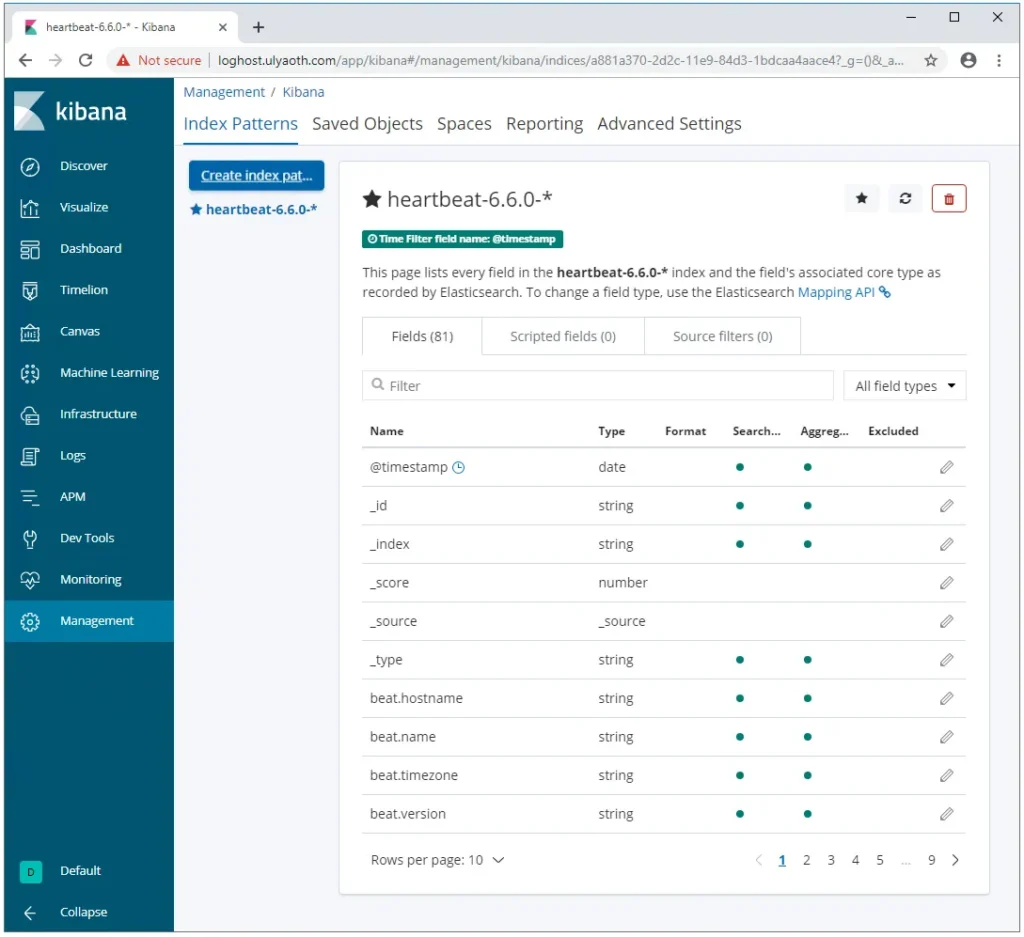
Create Index Patterns
Go back to Kibana and click “Connect to your Elasticsearch index.”
You will see this page:
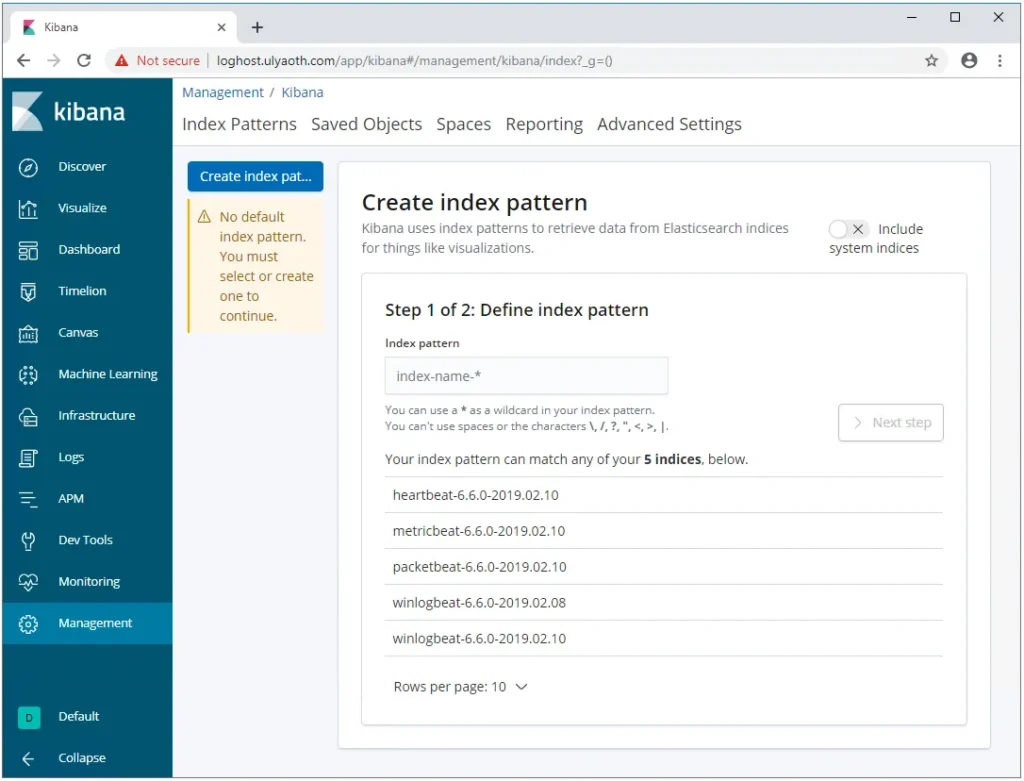
Create index patterns for each Beat:
heartbeat-6.6.0-*metricbeat-6.6.0-*packetbeat-6.6.0-*winlogbeat-6.6.0-*
For the Heartbeat index: Enter heartbeat-6.6.0-* in the Index pattern box.
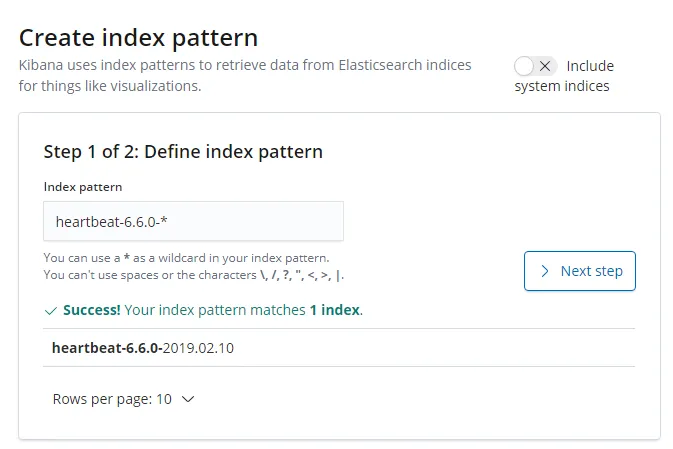
Press “Next step.”
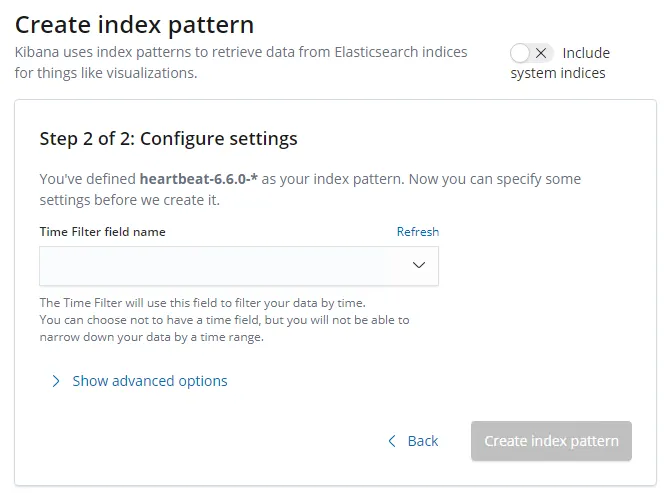
Select @timestamp for the Time Filter field name.
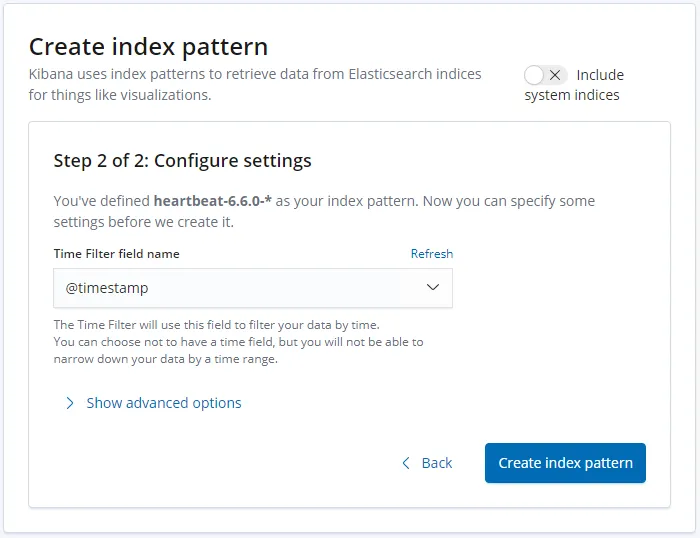
Press “Create index pattern.”
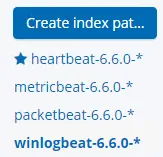
Repeat this for the other Beats. Once finished, they will appear on the left:
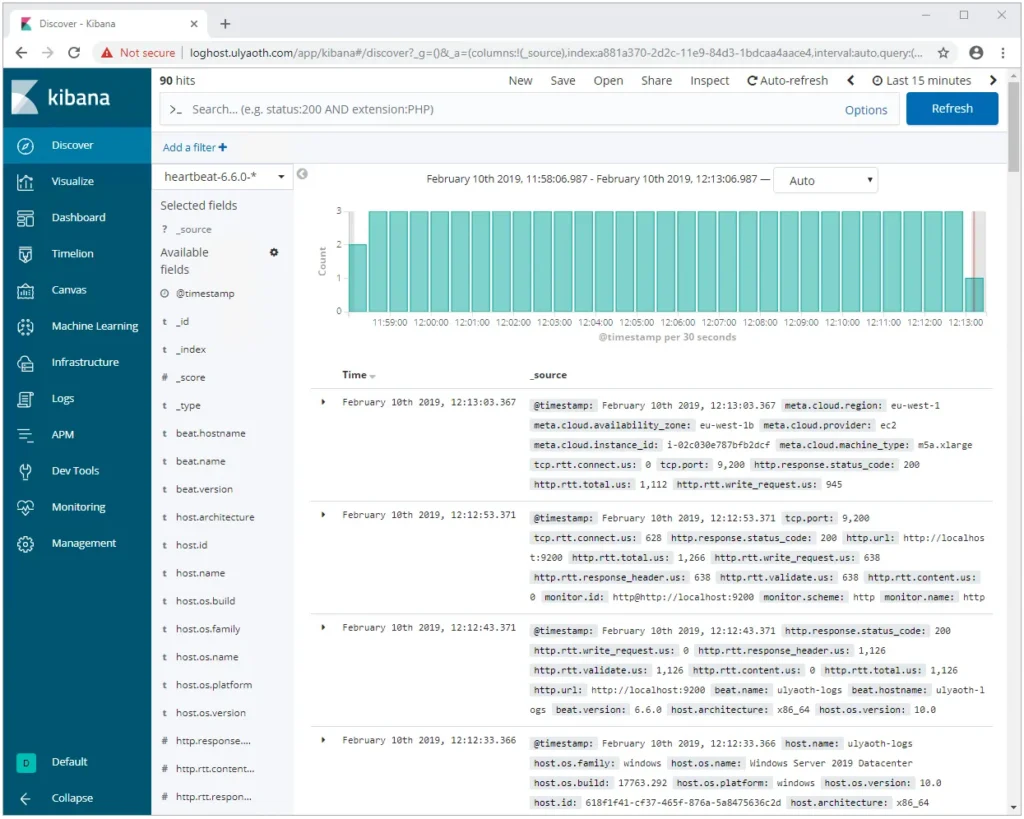
Click the “Discover” button to view your data!
I did not install Logstash as it wasn’t required for this setup, but the steps are very similar to Kibana.
Good luck with your Elastic Stack!