Archive: This content is maintained for historical reference. Please note that the specific versions and commands may no longer be compatible with modern systems.
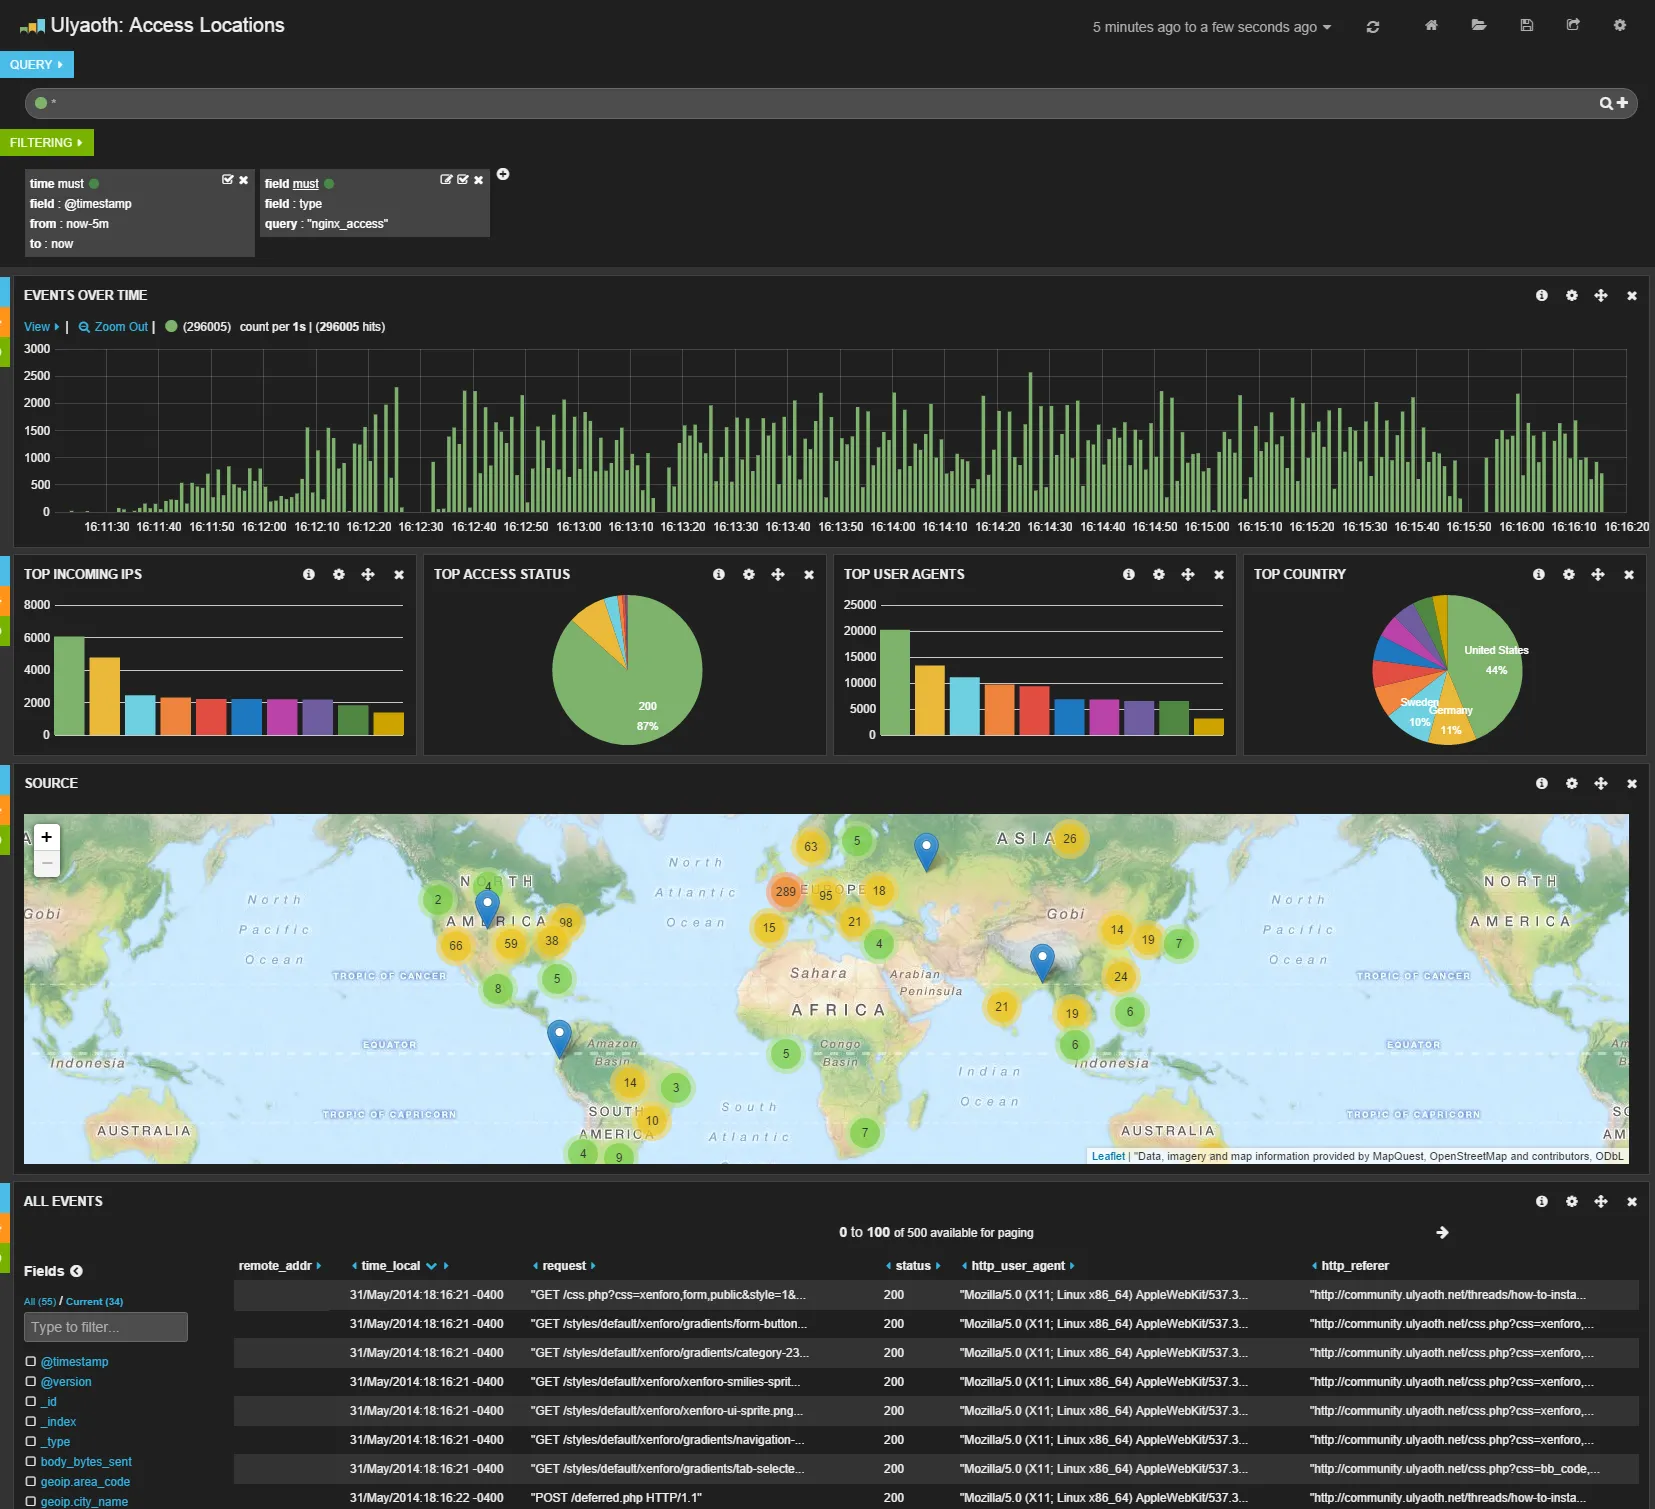
In this guide, I will show you how to create a GeoIP-based dashboard for Logstash. By analyzing your access logs, you can visualize exactly where your users are coming from.
While this example is based on Nginx, the same logic applies to Linux, Windows, Apache, or IIS. You simply need to adjust the Grok pattern to match your specific log format. Alternatively, you can configure Nginx to log directly in JSON format to avoid patterns altogether, but for this guide, we will assume you are using the default Nginx log format.
Installation Steps
Step 1: Update the Logstash Configuration
Navigate to your Logstash configuration directory, remove the existing config, and download the GeoIP-enabled version:
cd /etc/logstash/conf.d/
rm -rf logstash.conf
wget https://repoheim.eu/valkyoth/ulyaoth/raw/branch/master/guides/logstash/geoip/logstash.conf
Step 2: Download the Nginx Pattern
Logstash needs a specific pattern to understand Nginx logs. Download it to your patterns directory:
cd /opt/logstash/patterns/
wget https://repoheim.eu/valkyoth/ulyaoth/raw/branch/master/guides/logstash/patterns/nginx
Step 3: Download the Kibana Dashboard
Download the dashboard JSON file to your local computer (not the server):
https://repoheim.eu/valkyoth/ulyaoth/raw/branch/master/guides/logstash/dashboards/nginxaccesslocationsNote: You can change the dashboard title by opening the file in a text editor and editing the “Ulyaoth: Access Locations” string.
Loading the Dashboard
- Open your Kibana 3 web interface.
- Click the Load icon (the folder icon) in the top-right corner.
- Hover over Advanced and click Choose File.
- Select the
nginxaccesslocationsfile you downloaded in Step 3. - Once loaded, click the Save icon (disk icon) so you can access it directly from your saved dashboards in the future.
Understanding the Configuration
Let’s look at the details of the files we just downloaded.
1. The Nginx Pattern File
This file splits the raw Nginx access.log string into variables that Logstash can process.
NGINXACCESSLOG %{IPORHOST:remote_addr} - %{USERNAME:remote_user} \[%{HTTPDATE:time_local}\] %{QS:request} %{INT:status} %{INT:body_bytes_sent} %{QS:http_referer} %{QS:http_user_agent}Example Breakdown:
For a log entry starting with 8.8.4.4, the pattern works as follows:
- NGINXACCESSLOG: The name of the pattern referenced in
logstash.conf. - %{IPORHOST:remote_addr}: Matches the IP (
8.8.4.4). - %{INT:status}: Matches the HTTP status code (e.g.,
200). - %{QS:request}: Matches the actual request path (e.g.,
/styles/logo.png).
2. The Logstash Configuration (logstash.conf)
This file controls the flow of data. Here is the relevant filter section:
filter {
  if [type] == "nginx_access" {
    grok {
      patterns_dir => "./patterns"
      match => { "message" => "%{NGINXACCESSLOG}" }
    }
    geoip {
      source => "remote_addr"
      target => "geoip"
      database => "/opt/logstash/vendor/geoip/GeoLiteCity.dat"
      add_field => [ "[geoip][coordinates]", "%{[geoip][longitude]}" ]
      add_field => [ "[geoip][coordinates]", "%{[geoip][latitude]}" ]
    }
    mutate {
      convert => [ "[geoip][coordinates]", "float" ]
    }
  }
}
Key Components:
- Grok Filter: Tells Logstash to use the
NGINXACCESSLOGpattern we defined earlier if the log type isnginx_access. - GeoIP Filter: This is the core magic. It takes the
remote_addr(the user’s IP), looks it up in theGeoLiteCity.datdatabase, and generates coordinates. - Mutate: We convert the coordinates to a
floatso Kibana can plot them accurately on a map.
I hope this guide helps you get started with geographic data visualization! As I am also exploring this for the first time, feel free to reach out with any corrections or feedback.