Archive: This content is maintained for historical reference. Please note that the specific versions and commands may no longer be compatible with modern systems.
In this guide, I will demonstrate how to set up a Logstash server with a Kibana interface that receives logs via rsyslog. While there are many ways to ingest data into Logstash, we will focus exclusively on the rsyslog method here.
Technical Stack:
- OS: Fedora 20
- Logstash: 1.4
- Elasticsearch: 1.3
- Web Server: Nginx
- UI: Kibana 3
Step 1: Install Logstash
Install the Logstash RPM directly from the Elasticsearch repository:
$ sudo yum install https://download.elasticsearch.org/logstash/logstash/packages/centos/logstash-1.4.2-1_2c0f5a1.noarch.rpmStep 2: Install Nginx and Dependencies
$ sudo yum install nginx rsyslog tar wget policycoreutils-python zipStep 3: Install Elasticsearch
Download and install the Elasticsearch RPM:
$ sudo yum install https://download.elasticsearch.org/elasticsearch/elasticsearch/elasticsearch-1.3.4.noarch.rpmStep 4: Configure Logstash
Move to the configuration directory and download the predefined logstash.conf:
$ cd /etc/logstash/conf.d
$ sudo wget https://repoheim.eu/valkyoth/ulyaoth/raw/branch/master/guides/logstash/rsyslog/logstash.conf
$ sudo chown logstash:logstash logstash.conf
Step 5: Configure Nginx & Directory Structure
We need to create the directories for the Kibana web files and Nginx virtual hosts:
$ sudo mkdir -p /var/log/nginx/kibana /usr/share/nginx/kibana/public /etc/nginx/sites-available /etc/nginx/sites-enabled
$ sudo rm -rf /etc/nginx/nginx.conf
$ cd /etc/nginx/
$ sudo wget https://repoheim.eu/valkyoth/ulyaoth/raw/branch/master/guides/logstash/nginx/conf/nginx.conf
Note: Open
/etc/nginx/nginx.confand adjustworker_processesto match your CPU count (e.g.,2).
Step 6: Set up the Kibana Virtual Host
Download the vhost configuration and create a symbolic link to enable it:
$ cd /etc/nginx/sites-available/
$ sudo wget https://repoheim.eu/valkyoth/ulyaoth/raw/branch/master/guides/logstash/nginx/vhost/kibana.conf
Edit the file and change the server_name to your URL
$ sudo vi kibana.conf
$ sudo ln -s /etc/nginx/sites-available/kibana.conf /etc/nginx/sites-enabled/kibana.conf
Step 7: Install Kibana 3
Kibana 3 is a frontend-only application. We download it and move it to our Nginx public directory:
$ cd /usr/share/nginx/kibana/public
$ sudo wget https://download.elasticsearch.org/kibana/kibana/kibana-latest.tar.gz
$ sudo tar xzfv kibana-latest.tar.gz
$ sudo mv kibana-latest/* .
$ sudo rm -rf kibana-latest*
Step 8: Configure the Kibana Dashboard
1. Edit config.js and change default_route to /dashboard/file/ulyaoth.json.
2. Download the custom dashboard file:
$ cd /usr/share/nginx/kibana/public/app/dashboards
$ sudo wget https://repoheim.eu/valkyoth/ulyaoth/raw/branch/master/guides/logstash/kibana/dashboard/ulyaoth.json
3. Edit ulyaoth.json to change the “title” to your preferred name.
Step 9: Permissions and Security
Create a service user and update SELinux/Firewall settings:
$ sudo useradd -s /sbin/nologin kibana
$ sudo chown -R kibana:nginx /usr/share/nginx/kibana/
$ sudo chcon -R -t httpd_sys_content_t /usr/share/nginx/kibana/public/
$ sudo semanage port -a -t http_port_t -p tcp 9200

# Firewall settings
$ sudo firewall-cmd --zone=public --add-service=http
$ sudo firewall-cmd --zone=public --add-port=9200/tcp
Step 10: Start Services
$ sudo systemctl start elasticsearch.service
$ sudo systemctl start logstash.service
$ sudo systemctl start nginx.service
Step 11: Shipping Logs with rsyslog
On the client (or the same server), configure rsyslog to ship Nginx logs to Logstash on port 5544:
1. Open firewall port 5544:
$ sudo firewall-cmd --zone=public --add-port=5544/tcp
$ sudo firewall-cmd --zone=public --add-port=5544/udp
2. Create /etc/rsyslog.d/logstash.conf:
$ModLoad imfile

$InputFileName /var/log/nginx/kibana/error.log
$InputFileTag kibana-nginx-errorlog:
$InputFileStateFile state-kibana-nginx-errorlog
$InputRunFileMonitor

$InputFileName /var/log/nginx/kibana/access.log
$InputFileTag kibana-nginx-accesslog:
$InputFileStateFile state-kibana-nginx-accesslog
$InputRunFileMonitor

$InputFilePollInterval 10

if $programname == 'kibana-nginx-errorlog' then @your-logstash-ip:5544
if $programname == 'kibana-nginx-errorlog' then ~
if $programname == 'kibana-nginx-accesslog' then @your-logstash-ip:5544
if $programname == 'kibana-nginx-accesslog' then ~
3. Restart rsyslog:
$ sudo systemctl restart rsyslog.service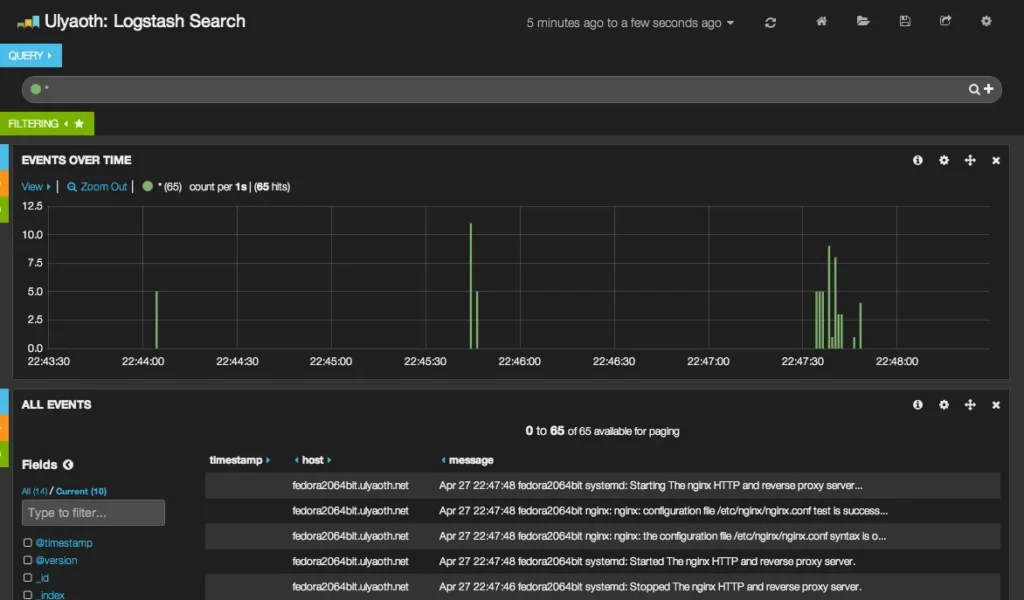
Troubleshooting & Tips
- Memory usage: Logstash and Elasticsearch are Java-based and can be memory-intensive.
- Encoding: If Logstash crashes due to non-UTF8 logs, ensure your input codec includes
charset => "ISO-8859-1". - Spam Prevention: The
then ~line in rsyslog is vital; it stops the logs from being written to/var/log/messagesafter they are sent to Logstash.